
Purchase Xanax Online Inspired by connecting data to maps to tell a story, I decided to bring stories together to tell a story with my map for this week. I wanted to create a map of famous fairytale locations, with icons that alluded to their story and pop ups that explained the fairytales in a new-fashioned way.
Ambien Without Prescription I did some searching for vector tiles that might tell the story better than the ones on leaflet, CartoDB and Stamen. I found an amazing option on MapBox that looked like an old world map – perfect for old, classic stories.
follow site I adjusted the code to fit the needs of this layer and script, and I was able to get a nice map working. I picked Europe as the center point, as most fairytales began there.
here Here is the code for that and the map can be found here.
https://www.appliquecafeblog.com/applique-towel/
https://anthonynewmancamps.com/education/ And then I went to the next step to add the tiles. After entering the Maki code and using the class files as a guide, I was able to debug most of the issues in my lines of code using developer tools and p5 to debug the program. And finally it came down to an error in the leaflet code:![]()
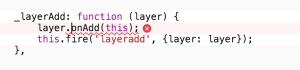
https://www.grupoursa.com/faq/ I tried changing the hierarchy of the script and code for the maki icons, thinking perhaps that would layer them above the tiles. However I met no success with anything I tried.
watch My next step was to switch out the MapBox map tiles for the CartoDB tiles. And the code and the icons worked just fine. This is all very surprising being that the icons and the tiles are both from MapBox.
https://www.beyondagencyprofits.com/about-bap/ So I continued to debug. (Let me just say that bugs are a big fear of mine, especially the large ones with wings…). I dug through the MapBox site and found this wee tutorial for putting markers without geojson and it appears as though the way to make the vector tile layer work with the marker tiles is not the same way as it is with the CartoDB or Stamen. You can’t create the var layer and then addLayer(layer). You have to do it this way:
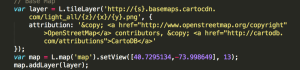
Order Xanax No Prescription CartoDB Version of Code
Zolpidem Buy Online MapBox Version of Code
Eszopiclone Lunesta Buy Online
go here Once I solved this, I was able to get the look that I wanted on that map.
https://bettierose.co.uk/faqs/ Here is the code and access to that map at this stage:
On to GEOJSON!
Using the online class resources, I was unable to get the map-geojason git code to work. I tried saving the data files of biggestcities.json and maryland.json (via sublimetext) into the folder, but still I kept getting these errors:
With Syntax on for getting external JSON
With Syntax off for getting external JSON
Here I am thinking that it has to do with how I have saved the files. Also it makes me think that MapBox has its very own way of having GeoJson added in, much like it did for the map. So to stick with the abilities that I have at this point, I am
I tried just re-downloading the files from the class github site and still got similar errors when running the code.
So I decided to go back to the CartoDB style map and set the parameters to the same for Europe as I had in my ideal map. The goal is for each country with a fairytale listed in the previous map, to be outlined.
I followed the code in the example from the class github – map-geojson.html and like the above situation, I got error codes such as:
![]() This leads me to believe that the line of code I am using in the script –>
This leads me to believe that the line of code I am using in the script –>
<script src=”http://code.jquery.com/jquery-1.11.3.min.js”> </script>
is not correct – but I am not sure what to replace it with.
A big note is to make sure that the Leaflet maki folder is found inside the same folder that you are calling in the code – preferably the same folder as the code’s file.
I attempted to try the same idea with the class code more geoJson and reached the same results. Nothing I am doing is producing any json results due to a cross over issue as mentioned above.
Here is code for both final attempts. (Please note that the data files are saved with the greece info.
(country data from: https://github.com/johan/world.geo.json/tree/master/countries)
Things to figure out:
1) Definitely not sure how to get the geojson code to work.
2) How can I get geojson working with the MapBox map?
3)How to add a line break in the text part of the icon labeling
4)How to add a title onto the page
Leave a Reply